1.10. Distributed
services 1.10.3. Dashboard |  |
| Prev | Next |
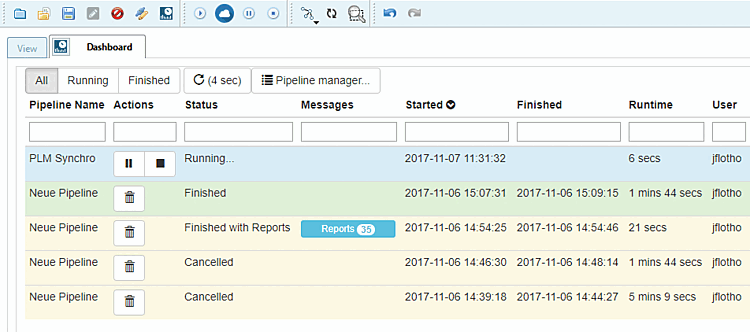
The dashboard provides you with detailed information on all processes (completed, canceled, running, failed).
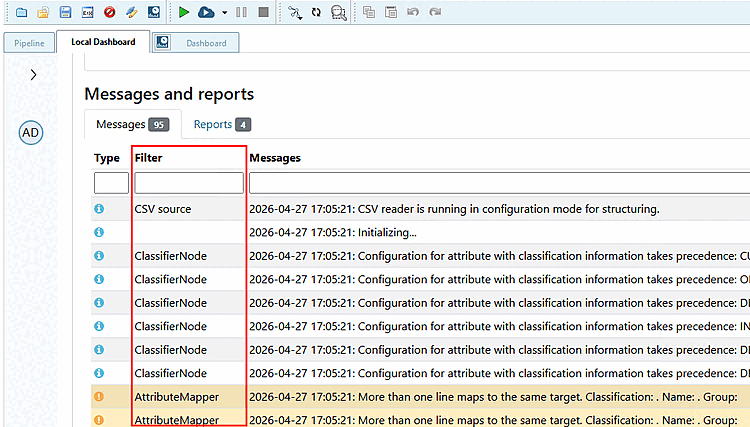
If you select a pipeline, the details are displayed. Please also note the Messages and Reports tabs for error analysis.
On the Messages Tabbed page, the Filter column shows in which node the respective problem can be found.
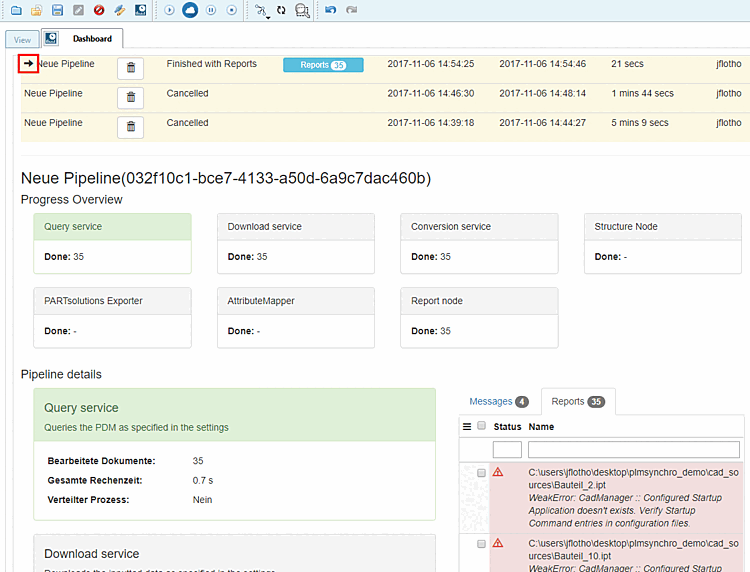
After selecting a pipeline, you will see the pipeline details.
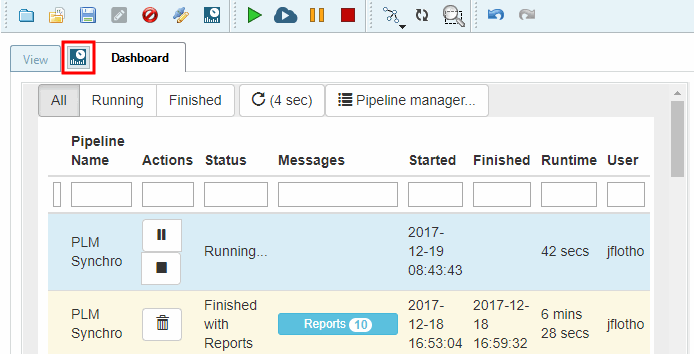
By clicking on the icon  icon in the Dashboard tab, you can open the dashboard in an external browser and therefore do not need PARTdataCenter.