2.2.5. User interface details

2.2.5.1. Structure tree
2.2.5.1.1. What does the tree represent?
2.2.5.1.2. Navigation in the structure tree
2.2.5.1.3. Coloring in the structure tree
2.2.5.1.4. Connection of tree and results (cluster) and statistical overview
2.2.5.2. Results
2.2.5.2.1. Edit cluster
2.2.5.2.2. Geometric similarity
2.2.5.2.3. Reference part
2.2.5.2.4. Color coding of variables
2.2.5.2.5. Duplicates" area
2.2.5.2.6. Workflow when deleting a main part
2.2.5.2.7. Part annotated in another cluster
2.2.5.3. Overview
2.2.5.4. Filter

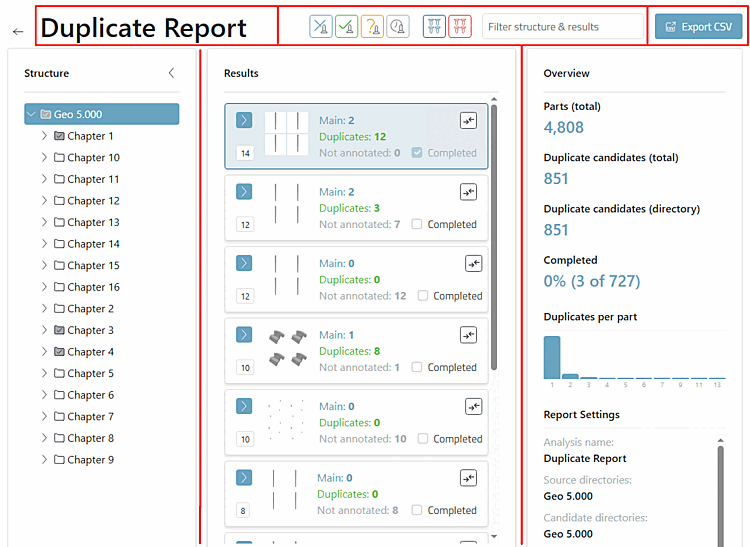
The report page is subdivided as follows:

The header contains the name of the report, a filter area and an export CSV button.

The main area is subdivided into structure tree, results and an overview (will be adapted according to the work on the individual clusters).