7.8.13.
Value ranges
7.8.13.3. Type
"Value range variable with graphics "
|  |
| Prev | Next |
If graphics are also to be displayed for a value range variable, select the type Value range variable with graphics.
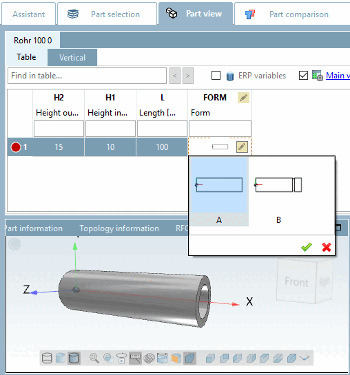
The illustration shows a created value range variable with graphics [Value range variable with graphics] in the PARTdesigner
The following example explains how to create a value range with graphics [Value ranges with images]:[97]
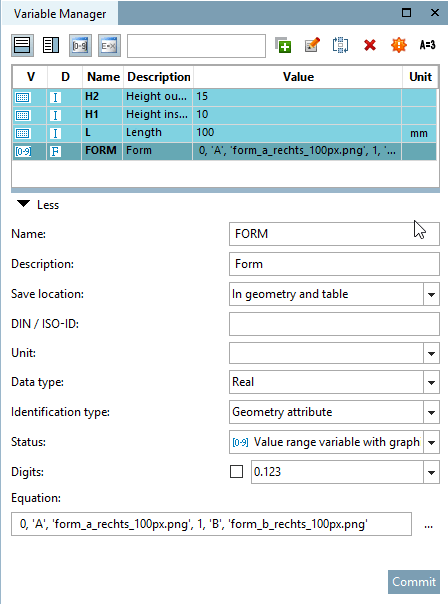
The first step is to create a value range variable in the variable manager [Variable Manager]. Here in the example FORM.
Create the variable with the corresponding parameters.[98]
Storage location [Save location]: Select In In geometry and table.
Type identification [Identification type]: Geometric feature [Geometry attribute] here
Status: Select the option Value range variable with graphics.
Enter all parameters with the correct syntax under Formula [Equation].
| ||||
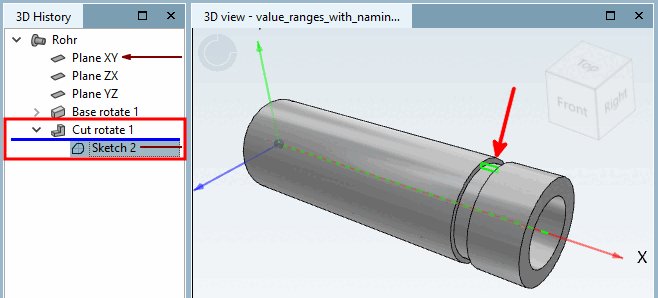
In the second step, you create a sketch in the Sketcher, for example, which is used to create a "cut".
In the third step, you link the cut sketch with a corresponding condition [Condition], which creates or omits the cut depending on the value selection of the FORM variable.
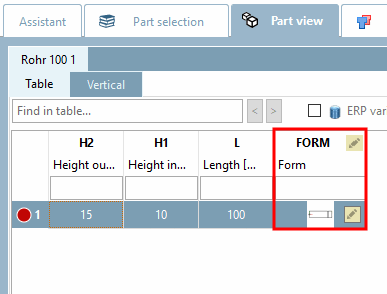
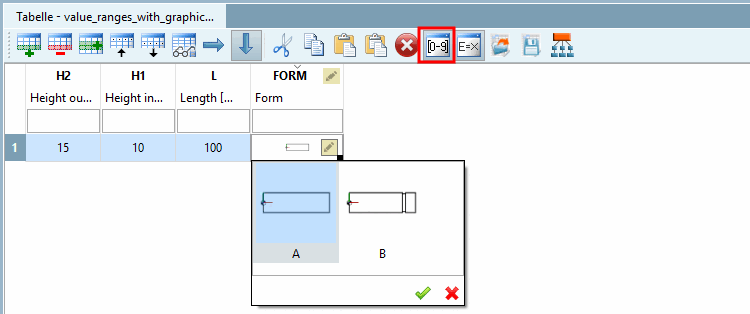
Test the functionality directly in the PARTdesigner in the Table docking window. (Using the button  button to show and hide value range columns)
Click in the value range field and select the desired value.
You can test just as well in the PARTdataManager test. The table view and value selection is identical to the PARTdesigner.
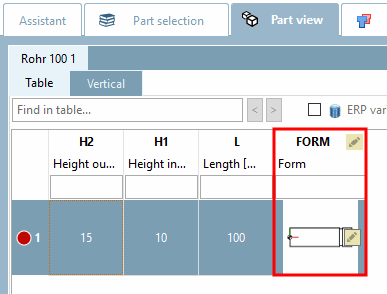
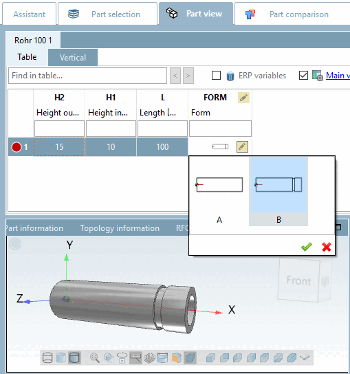
In the FORM column, click on the value range symbol  column and select the desired shape.
You have the option of displaying graphics instead of the text in the PARTdataManager in the table column.
The prerequisite for this is that the relevant variable name is entered in PARTproject on the General tab page, in the Variables block under Variables with graphics [Variables containing graphics], the relevant variable name must be entered (here in the example FORM ).
With pressed Ctrl key and mouse wheel you can zoom graphics.
[97] You can find the appropriate example in the training catalog in the directory \v11_news\value_ranges\value_ranges_with_graphic\value_ranges_with_graphic.prj.
[98] Basic information on the procedure can be found at Section 7.8.10, “ Variable manager - The individual parameters ”.
![The illustration shows a created value range variable with graphics [Value range variable with graphics] in the PARTdesigner](resources/img/img_dbdfb69d8b4449a9b2f555f44bcf48de.png)
![[Note]](images/note.png)
![Only generate if applies [Only create, if] Only generate if applies](resources/img/img_7031d49138e3460685d2fa1f24d96380.png)
![PARTproject - Columns with graphics [Columns containing graphics]](resources/img/img_0a1e9f45e5e34dcca72bf3981ebfbccd.png)